2 June 2014 by Remco Bouckaert
A few weeks ago, we had a look at a simultion study with BEAST, using the SequenceSimulator, LogAnalyser and R. Let’s do that study again, but now with BEASTShell, a package for scripting BEAST-objects. It is based on BeanShell, but has special extentions to conveniently deal with BEASTObject classes.
In the previous blog, I sampled sequences for a range of shape parameter values that seemed reasonable in my experience. However, the model assumes an exponential prior distribution over the shape parameters with mean 1, so arguably, that information is sufficient to draw shape values from. In this study, we will
- sample 100 values of the shape parameter from this prior distribution,
- sample an alignment with 10.000 characters using 4 gamma categories and one of the sampled shape paramter values
- run the analysis on the sampled data
- record the estimate of the shape parameter
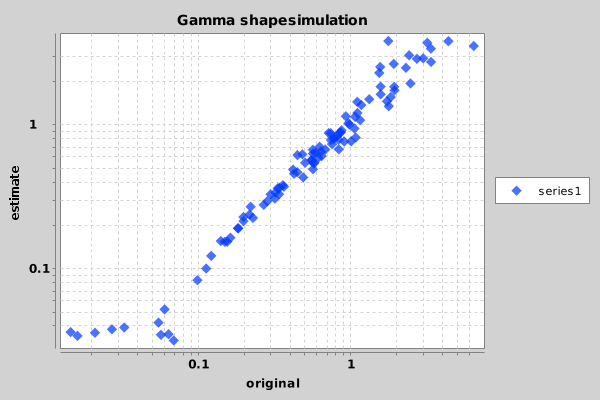
- create a plot of sampled against estimated shape values
Let’s get started with BEASTShell. The easiest way to create scripts is using BEASTStudio, the BEASTShell GUI. First, we import a bunch of packages we are going to need. BEASTShell already loads a nuber of packages (javax.swing.event, javax.swing, java.awt.event, java.awt,java.net, ava.util,java.io, and java.lang) which makse it easy to create standard class instances.
import beast.evolution.substitutionmodel.*;
import beast.evolution.sitemodel.*;
import beast.evolution.alignment.*;
import beast.util.*;
import beast.core.*;
import com.xeiam.xchart.*;
import beast.app.shell.*;
First, we draw gamma shape from the prior (exp(1.0))
shapes = rexp(100, 1.0);
estimate = new ArrayList<Double>();
Newx, we set up a model to draw samples from
data = new Alignment(
		sequence=new Sequence(taxon="human",value="?"),
		sequence=new Sequence(taxon="bonobo",value="?"),
		sequence=new Sequence(taxon="chimp",value="?")
	);
tree = new beast.util.TreeParser(newick="(human:0.2,(chimp:0.15,bonobo:0.15):0.05)", taxa=data, IsLabelledNewick=true);
hky = new HKY(kappa="5.0", frequencies=new Frequencies(data=data));
clockmodel = new beast.evolution.branchratemodel.StrictClockModel("1.0");
For each of the shape values (shape0 in the following), we set up a site model with gamma shape parameter
sitemodel = new SiteModel(gammaCategoryCount=4, substModel=hky, shape=""+shape0); mergewith = new beast.app.seqgen.MergeDataWith(template="analysis.xml", output="analysis-out.xml"); sim = new beast.app.seqgen.SequenceSimulator(data=data, tree=tree, sequencelength=10000, outputFileName="gammaShapeSequence.xml", siteModel=sitemodel, branchRateModel=clockmodel, merge=mergewith);
sim.run();This produces gammaShapeSequence.xml and merge it with analysis.xml to get analysis-out.xml. Now we can run the analysis using:
	mcmc = (new XMLParser()).parseFile(new File("analysis-out.xml"));
	mcmc.run();
After this finished in a minute or so, we grab estimates from the analysis using the LogAnalyser, and store it in the estimate list.
	log = new LogAnalyser(new String[]{"SequenceSimulator.log"}, 2000, 10);
	s = log.getMean("gammaShape");
	estimate.add(s);
After we have done this for all generated shape parameter values, we can draw a scatter plot and save to “Sample_Chart.png”, using
p = new Plot(x=shapes, y=estimate, title="Gamma shape\nsimulation", xAxisTitle="original", yAxisTitle="estimate", chartType="Scatter", isYAxisLogarithmic=true, isXAxisLogarithmic=true, output="png");This analysis just overwrites log files for each generated alignment. To tell BEAST to overwrite, we need
Logger.FILE_MODE = beast.core.Logger.LogFileMode.overwrite;Furthermore, we want to use BEAGLE, but dependeing on your hardware, this may not speed things up. Setting BEAGLE flags can be done like so:
beagleFlags = beagle.BeagleFlag.VECTOR_SSE.getMask() | beagle.BeagleFlag.PROCESSOR_CPU.getMask();
System.setProperty("beagle.preferred.flags", Long.toString(beagleFlags));
Running the analysis
So, that gives us the following complete script.
// This script demonstrates a simulation study for the

// shape parameter in the gamma rate heterogeneity model.

// Requirements: the file analysis.xml must be in the directory

// from where this script is run.


import beast.evolution.substitutionmodel.*;
import beast.evolution.sitemodel.*;
import beast.evolution.alignment.*;
import beast.util.*;
import beast.core.*;
import com.xeiam.xchart.*;
import beast.app.shell.*;

Logger.FILE_MODE = beast.core.Logger.LogFileMode.overwrite;

// set up flags for BEAGLE -- YMMV

beagleFlags = beagle.BeagleFlag.VECTOR_SSE.getMask() | beagle.BeagleFlag.PROCESSOR_CPU.getMask();
System.setProperty("beagle.preferred.flags", Long.toString(beagleFlags));

// draw gamma shape from the prior (exp(1.0))

shapes = rexp(100, 1.0);
estimate = new ArrayList<Double>();

// set up model to draw samples from

data = new Alignment(
		sequence=new Sequence(taxon="human",value="?"),
		sequence=new Sequence(taxon="bonobo",value="?"),
		sequence=new Sequence(taxon="chimp",value="?")
	);
tree = new beast.util.TreeParser(newick="(human:0.2,(chimp:0.15,bonobo:0.15):0.05)", taxa=data, IsLabelledNewick=true);
hky = new HKY(kappa="5.0", frequencies=new Frequencies(data=data));
clockmodel = new beast.evolution.branchratemodel.StrictClockModel("1.0");

k = 0;
for (shape0 : shapes) {
	sitemodel = new SiteModel(gammaCategoryCount=4, substModel=hky, shape=""+shape0);
	//sim = new beast.app.seqgen.SequenceSimulator(data=data, tree=tree, sequencelength=10000, outputFileName="gammaShapeSequence.xml", siteModel=sitemodel, branchRateModel=clockmodel);

	// produce gammaShapeSequence.xml

	//sim.run();


	mergewith = new beast.app.seqgen.MergeDataWith(template="analysis.xml", output="analysis-out.xml");
	sim = new beast.app.seqgen.SequenceSimulator(data=data, tree=tree, sequencelength=10000, outputFileName="gammaShapeSequence.xml", siteModel=sitemodel, branchRateModel=clockmodel, merge=mergewith);
	// produce gammaShapeSequence.xml and merge with analysis.xml to get analysis-out.xml

	sim.run();

	// run the analysis

	mcmc = (new XMLParser()).parseFile(new File("analysis-out.xml"));
	mcmc.run();

	// grab estimate from the analysis

	log = new LogAnalyser(new String[]{"SequenceSimulator.log"}, 2000, 10);
	s = log.getMean("gammaShape");
	print("iteration: " + (k++) + " shape = " + shape0 + " estimate = " + s);
	estimate.add(s);
}

// create scatter plot and save to /tmp/Sample_Chart.png

p = new Plot(x=shapes, y=estimate, title="Gamma shape\nsimulation", xAxisTitle="original", yAxisTitle="estimate", chartType="Scatter", isYAxisLogarithmic=true, isXAxisLogarithmic=true, output="png");
You can run the analysis in BEASTStudio, but you can also run it from the command line, which is probably a bit faster. BEASTShell has a command line interpreter that can be started with
java -cp beast.jar:bsh.jar bsh.Interpreter examples/simstudy.bshOnce you ran the script, something similar to the following image should appear in the file Sample_Chart.png.

Looks like the shape parameter can be fairly reliably recovered from a large range of shape values. Only at the extremes — below 0.05 and over 15 — the prior is drawing the estimate to the mean.
