20 January 2021 by Remco Bouckaert
This is a how-to on making plots like this:
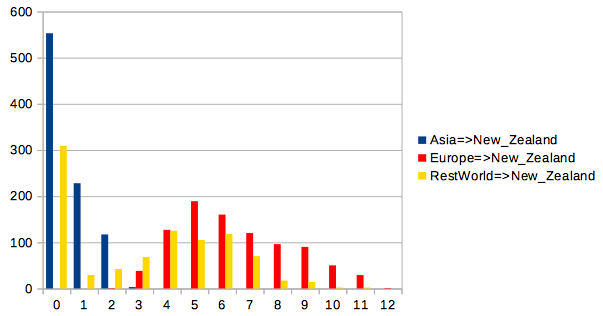
Counting the number of introductions from individual places
Counting the number of introductions from all other places
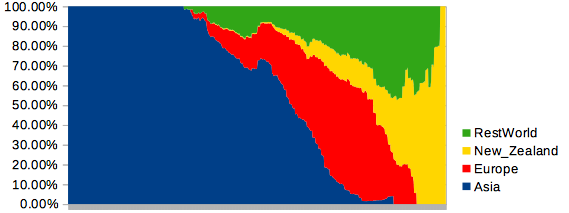
Lineages through time being at a particular location
This involves 3 steps
- Generate tree file with BEAST
- Run
StateTransitionCounter - Plot
StateTransitionCounterresults in bar graph
1. Generate tree file with BEAST
Set up an analysis that stores location/deme information in a tree file, e.g.,
like a discrete trait (DTA) analysis, but Mascot and BDMM
analyses or anything else that stores states as meta data should work as well. The tree file
should have metadata on the nodes of the form tag=value pairs where tag can be location
and value one of the demes under consideration.
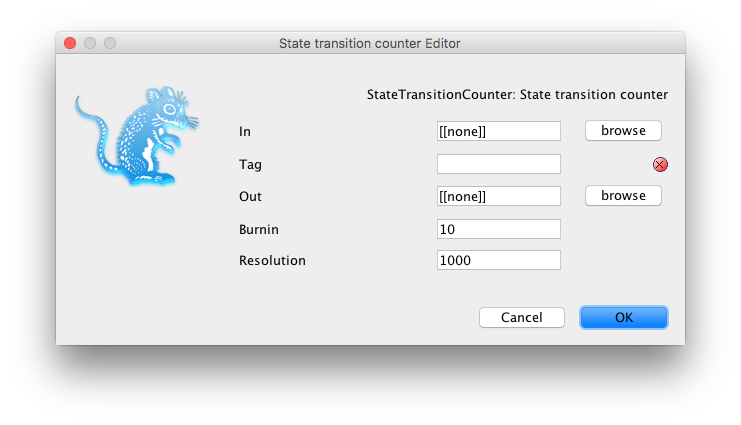
2. Run StateTransitionCounter
StateTransitionCounter is a tool in Babel v0.3.0 (use the package manager
to install, or build Babel from source, and install by hand). Once it is installed, you
can run it via the File/Launch Apps menu in BEAUti, which then shows a dialog like so:
or on a terminal with the applauncer, e.g. like so:
/path/to/beast/bin/applauncher StateTransitionCounter -tag location -in beast.trees
where /path/to/beast the path to where BEAST is installed on your computer.
StateTransitionCounter takes the following arguments:
- in (TreeFile): source tree (set) file (required)
- tag (String): label used to report trait (required)
- out (OutFile): output file, or stdout if not specified (optional, default: [[none]])
- burnin (Integer): percentage of trees to used as burn-in (and will be ignored) (optional, default: 10)
- resolution (Integer): number of steps in lineages through time table (optional, default: 1000)
NB 1. On Windows with BEAST v2.6.2, this should be \path\to\BEAST\bat\applauncher.bar instead
of /path/to/beast/bin/applauncher.
NB 2. Note that applauncher allows abbreviating its arguments, so the following should run the same:
/path/to/beast/bin/applauncher StateT -t location -i beast.trees
StateTransitionCounter counts the number of branches in a tree that have a certain state
at the parent and another at the node. It produces a report like so:
| Transition | mean | 95%Low | 95%High |
|---|---|---|---|
| Asia=>Asia | 162.16759156492785 | 156.0 | 170.0 |
| Asia=>Europe | 10.34850166481687 | 5.0 | 17.0 |
| Asia=>New_Zealand | 0.5349611542730299 | 0.0 | 2.0 |
| Asia=>RestWorld | 6.889012208657047 | 4.0 | 10.0 |
| Europe=>Asia | 0.7613762486126526 | 0.0 | 2.0 |
| Europe=>Europe | 124.22419533851276 | 112.0 | 135.0 |
| Europe=>New_Zealand | 6.407325194228635 | 3.0 | 11.0 |
| Europe=>RestWorld | 11.894561598224195 | 8.0 | 17.0 |
| … | … | … | … |
Histogram
| Transition | 0 | 1 | 2 | 3 | 4 | 5 | … |
|---|---|---|---|---|---|---|---|
| Asia=>Asia | 0 | 0 | 0 | 0 | 0 | 0 | … |
| Asia=>Europe | 0 | 0 | 0 | 0 | 8 | 28 | … |
| Asia=>New_Zealand | 552 | 225 | 115 | 9 | 0 | 0 | … |
| … | … | … | … | … | … | … | … |
Lineages through time
| Transition | 0.0 | 4.211E-4 | 8.422E-4 | 0.001263 | 0.001684 | 0.002105 | … |
| — | — | — | — | — | — | — | … |
| Asia | 2.0 | 2.0 | 2.0 | 2.0 | 2.0 | 2.0 | … |
| Europe | 0.0 | 0.0 | 0.0 | 0.0 | 0.0 | 0.0 | … |
| New_Zealand | 0.0 | 0.0 | 0.0 | 0.0 | 0.0 | 0.0 | … |
| RestWorld | 0.0 | 0.0 | 0.0 | 0.0 | 0.0 | 0.0 | … |
In the first table, the first columns represent the state transition with first the parent state and second the node state. The mean column is the mean number observed in the tree set, and 95%Low and 95%Hi are the 2.5% fraction and 97.5% fraction of the distribution (so, not necessarily the 95% HPD).
The second table is a histogram of transition counts, with the first row representing the number of counts and the first column representing the number of trees with zero transitions, next column 1, etc.
The third table represents a lineage through time plot, where the first row is the time and the numbers in following rows represent how many branches are in a particular state/location.
Create bar graph
The numbers from the table produced by StateTransitionCounter can be manipulated, for
example in a spread sheet, and the rows and columns of interest selected from them.
| transition | 0 | 1 | 2 | 3 | 4 | 5 | 6 | 7 | 8 | 9 | 10 | 11 |
|---|---|---|---|---|---|---|---|---|---|---|---|---|
| Asia=>New_Zealand | 552 | 225 | 115 | 9 | ||||||||
| Europe=>New_Zealand | 0 | 0 | 23 | 131 | 187 | 180 | 130 | 100 | 74 | 49 | 25 | 2 |
| RestWorld=>New_Zealand | 311 | 25 | 39 | 66 | 109 | 143 | 136 | 50 | 14 | 8 |
You can then export them as a graph (like the ones at the start of this page), or export to R and apply you favourite transformation on it.
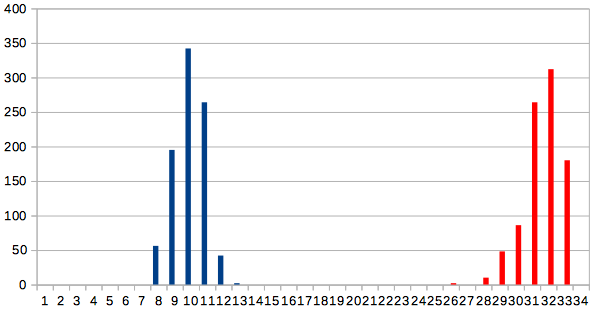
NB To create a bar graph that contains transitions between groups of values, just open
the tree file in a text editor and search/replace values. For example, the second graph at
the top of the page is from the same tree set as the first, but with value
location="Asia",
location="RestWorld", and
location="Europe" all replaced by location="RestOfWorld".