23 July 2019 by Remco Bouckaert
Creating post-processing tools for packages becomes much easier when exporting data to HTML, and with the help of a little bit of JavaScript and style sheets, can be made to look good with little effort. There is also some support in BEASTLabs to make life easier. We will go through a few examples, and demonstrate how to- draw a simple trace log
- make a presentable table
- draw more complex graphs
Step 1: setting up a BEASTObject
The first thing to do is set up a class derived from beast.core.Runnable and specify inputs. To draw a trace of a single entry from a trace log we need to know- the file name of the log file
- how much burnin to use
- the entry of the trace log to plot
public class MiniTracerPlotly extends Runnable {
	public Input<File> traceLogInput = new Input<>("file", "Input file containing a trace log", Validate.REQUIRED);
	public Input<Integer> burninInput = new Input<>("burnin", "percentage of the log file to disregard as burn-in (default 10)", 10);
public Input<String> traceInput = new Input<>("trace", "name of the parameter/log entry to plot", "posterior"); private File tracelog;
private Integer burnin = 10;
private String trace = "posterior";
public void initAndValidate() {
this.tracelog = traceLogInput.get();
this.burnin = burninInput.get();
this.trace = traceInput.get();
}Step 2: Add Application
To make the class run, we just create a beast.app.util.Application and pass on this object and any command line arguments passed when starting:public static void main(String[] args) throws Exception {
new Application(new MiniTracerPlotly(), "MiniTracer", args);
}Step 3: implement run()
The run() method does the actual work of loading the file, processing the data (not much here except finding the right column of the trace file) and writing an HTML page with a graph. @Override
public void run() throws Exception {
if (burnin < 0) {
burnin = 0;
}
LogAnalyser traces = new LogAnalyser(tracelog.getAbsolutePath(), burnin, false, false);
Double [] data = traces.getTrace(trace);
Double [] labels = traces.getTrace("Sample");
		// create plot.ly chart see http://plot.ly/ for documentation
		String html = "<html>\n" +
		"<title>BEAST " + new BEASTVersion2().getVersionString() + ": miniTracer</title>\n" +
		"<head>\n" +
		"<script src='plotly-latest.min.js'></script>\n" +
		"</head>\n" +
		"<body>\n" +
		"<h2>Trace of " + trace + " from " + tracelog.getPath() +"</h2>\n" +
		"<div id='chart'/>\n" +
		"<script>\n" +
		"var data = [\n" +
		"  {\n" +
		"    x: " + Arrays.toString(labels)+ ",\n" +
		"    y: " + Arrays.toString(data)+ ",\n" +
		"    type: 'scatter'\n" +
		"  }\n" +
		"];\n" +
		"\n" +
		"Plotly.newPlot('chart', data);\n" +
		"</script>\n" +
		"<p>This is a simple graph with all settings at default. "
		+ "Click the 'edit' button (which appears at the top of the graph when you hover over the graph) "
		+ "to change the colours and other styles. "
		+ "To see how the javascripts changes, click the JSON button in the style editor.</p>\n" +
		"</body>\n" +
		"</html>";
	// write html file in package dir + "/js/minitracer.html"
	String jsPath = Application.getPackagePath("BeastApp.addon.jar") + "js";
        FileWriter outfile = new FileWriter(jsPath + "/minitracer.html");
        outfile.write(html);
outfile.close(); // open html file in browser
Application.openUrl("file://" + jsPath + "/minitracer.html");
}Step 4: launching the App
To be able to launch the App, we need to add an entry in the version.xml file in the package, which looks something like this:<addon name='BeastApp' version='0.0.1'>
<depends on='beast2' atleast='2.6.0'/>
<depends on='BEASTLabs' atleast='1.9.0'/>
<addonapp description="MiniTracerPlotly"
class="examples.MiniTracerPlotly"
args=""
/>
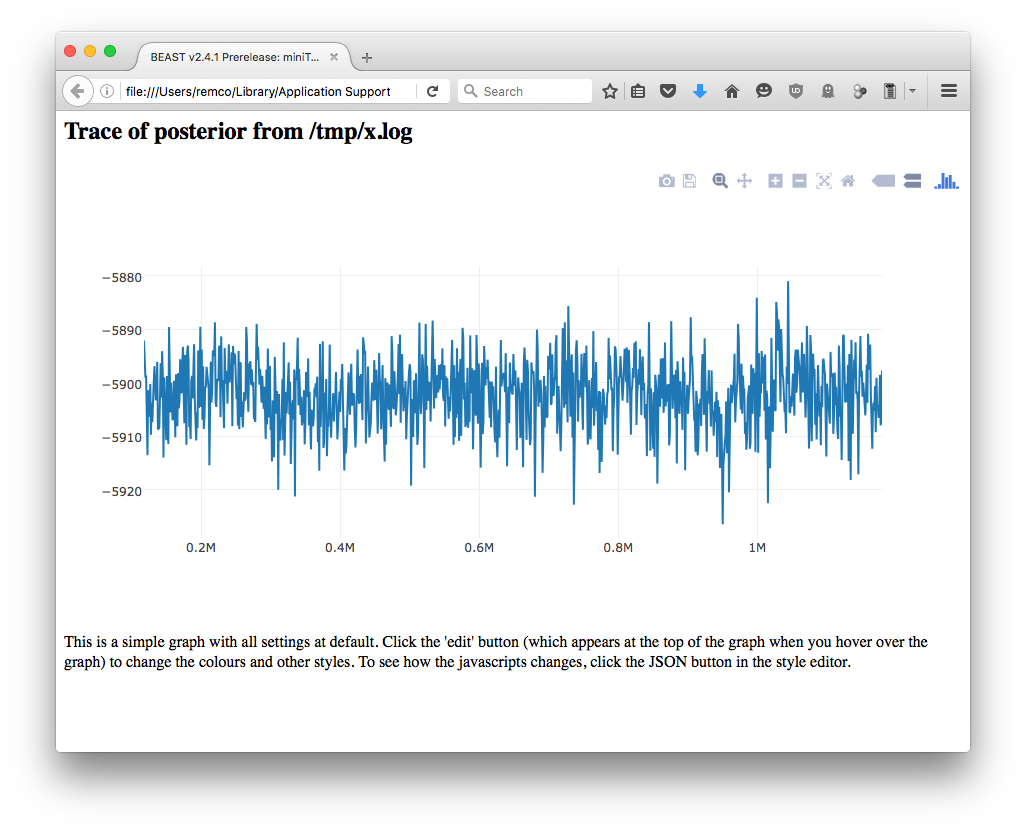
</addon>/path/to/applauncher MiniTracerPlotly -file trace.log -burnin 20 -trace prior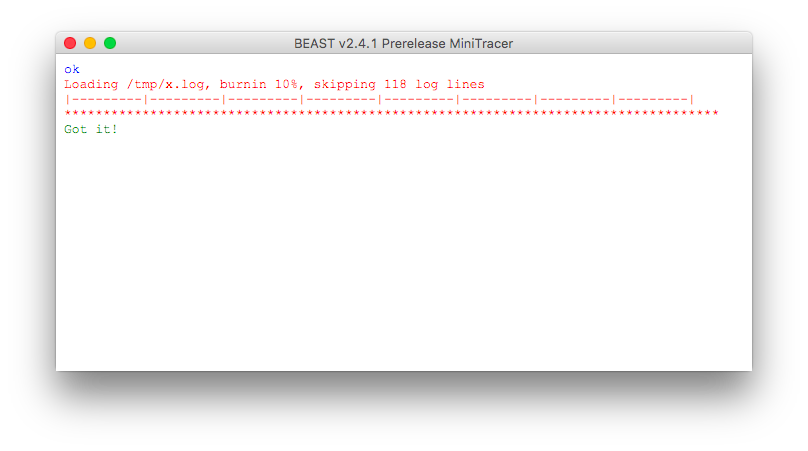 After it is finished, a web browser page should pop up that looks something like this:
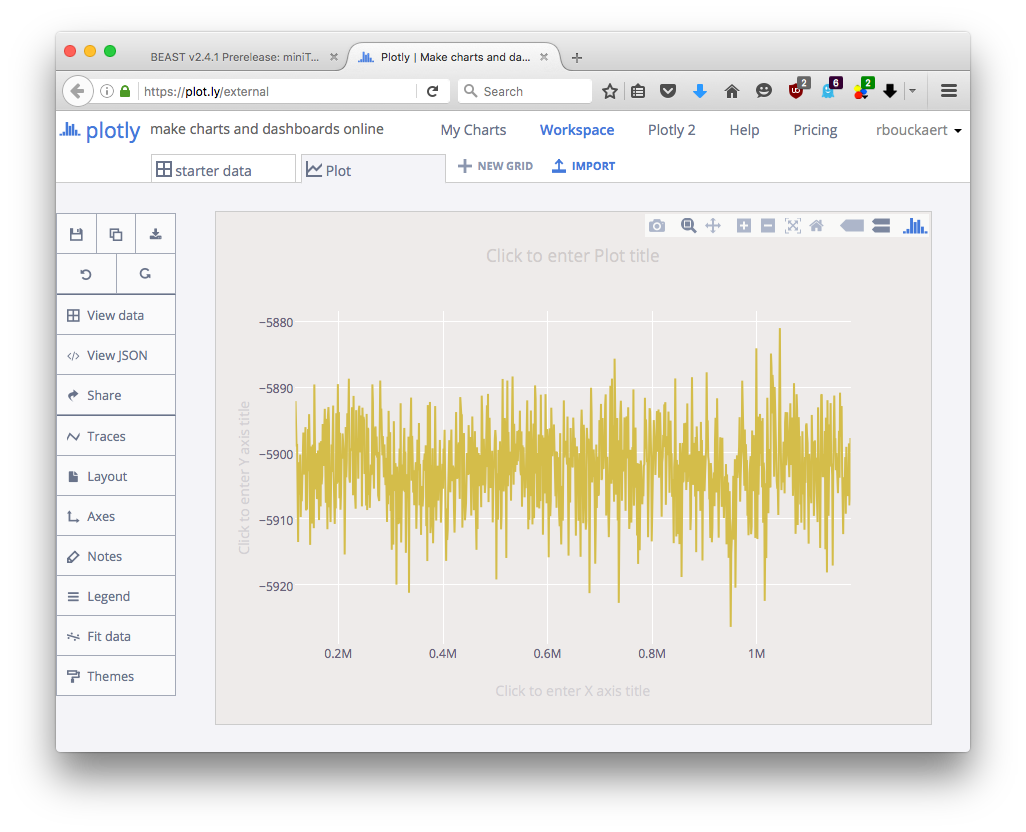
 Plotly lets you zoom in and scroll through the graph. Also, when you can edit the style of the graph by clicking the 'Edit' button in the graph:
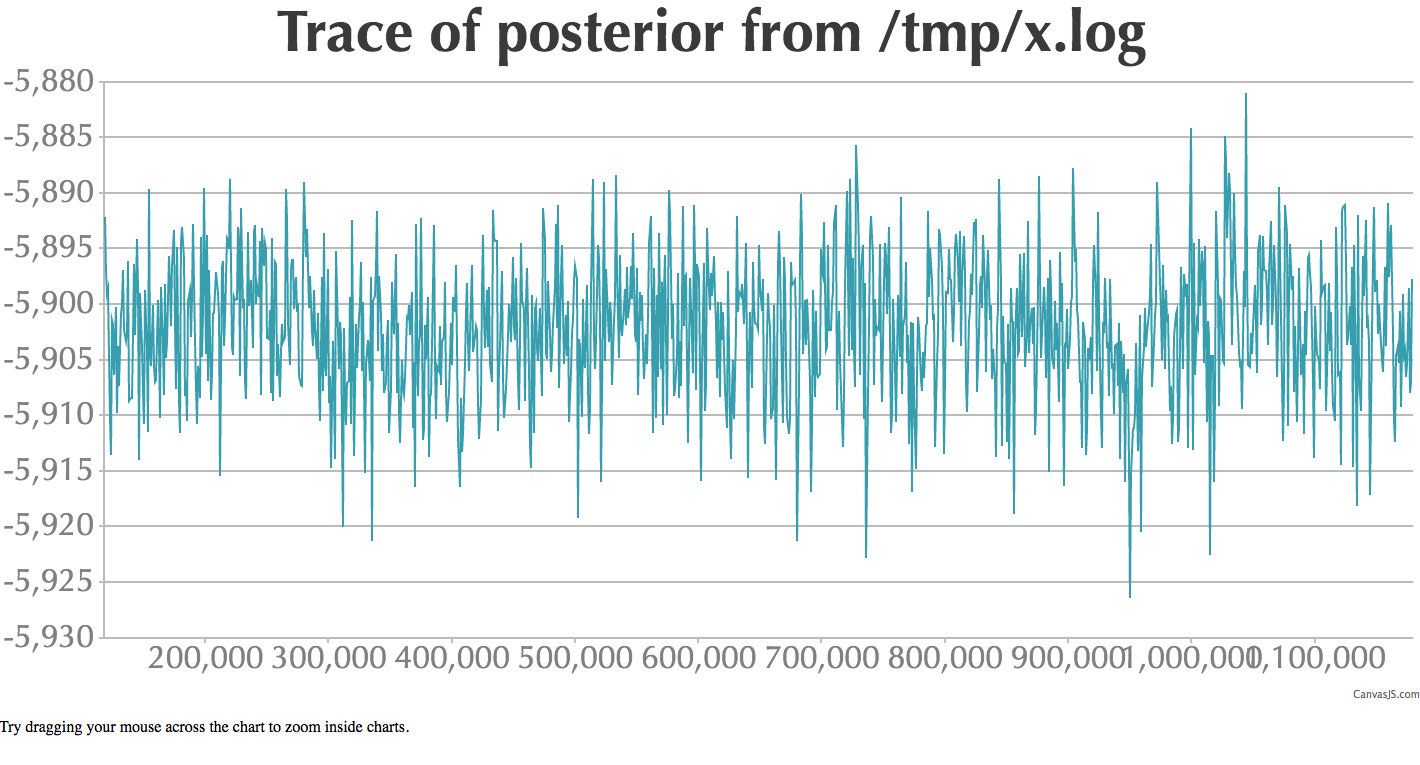
 An alternative is to use the CanvasJS library -- see implementation here, which looks something like this:
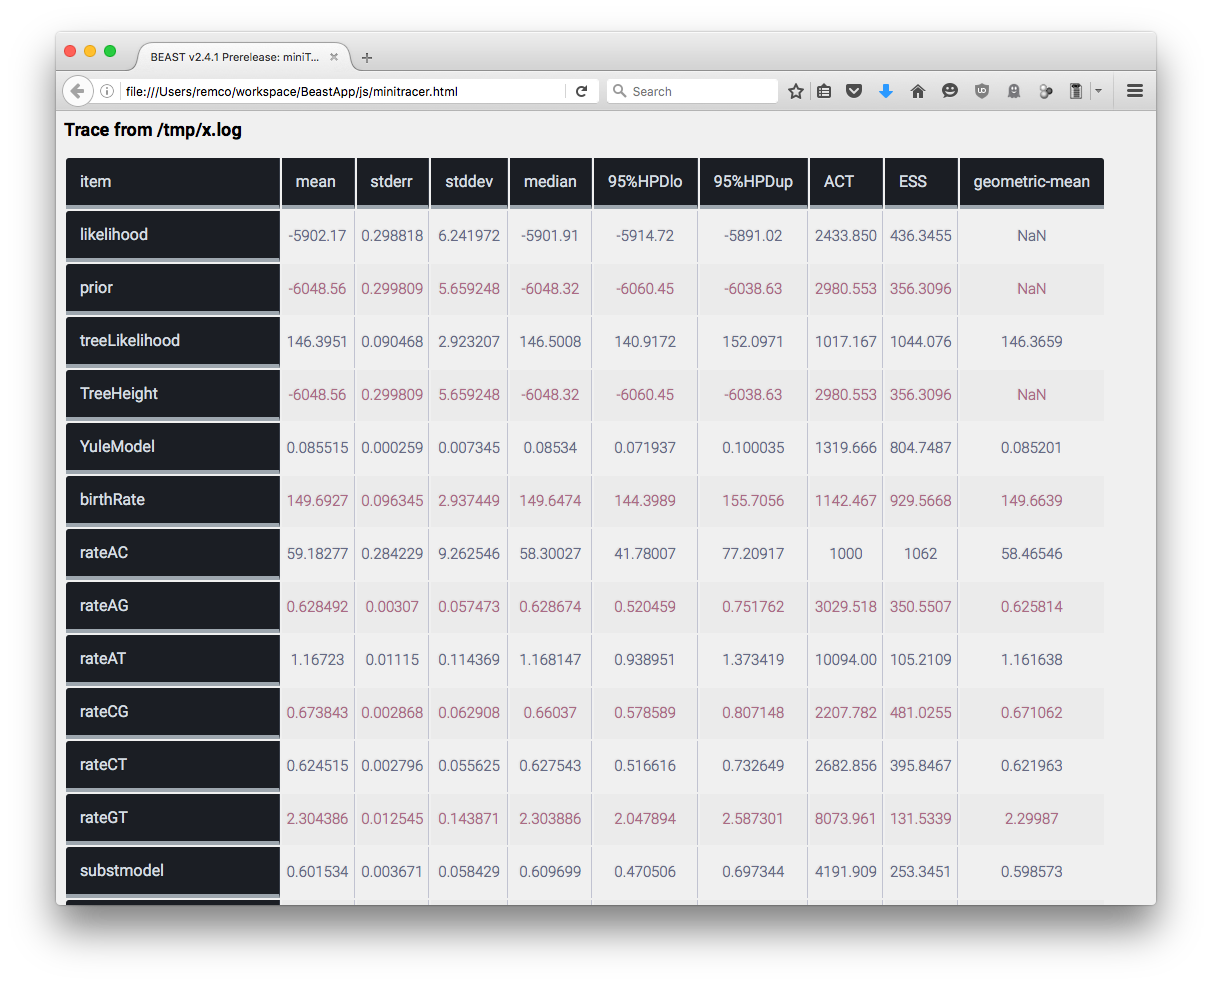
 In the BeastApp package there is also an example for creating tables that look something like this:
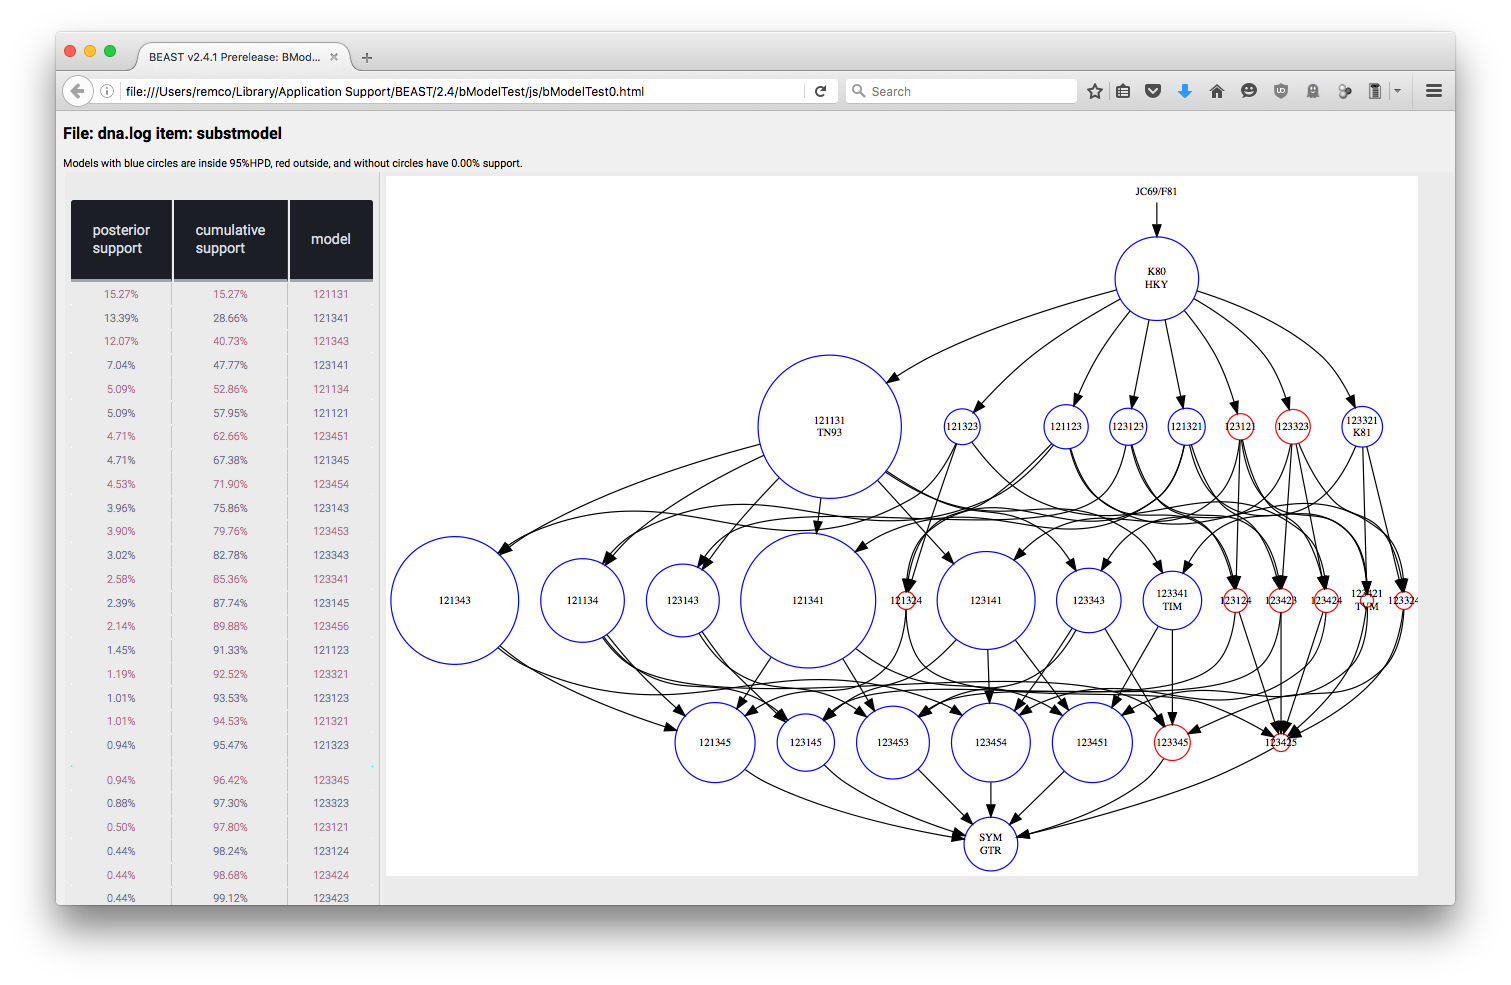
 There is even a dot-interpreter, which is used in the bModelTest package, and produces output that looks like so: